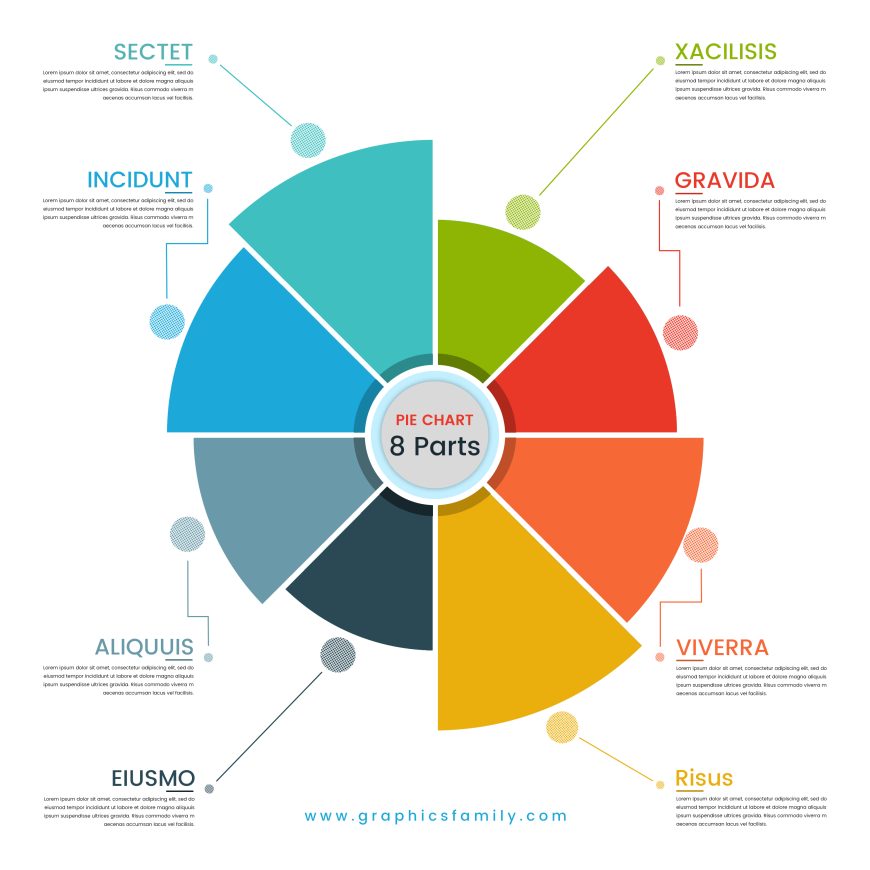
Flat style pie chart circle infographic template vector image
🚀 Simplify Complex Data with Eye-Catching Graphics! 🌟
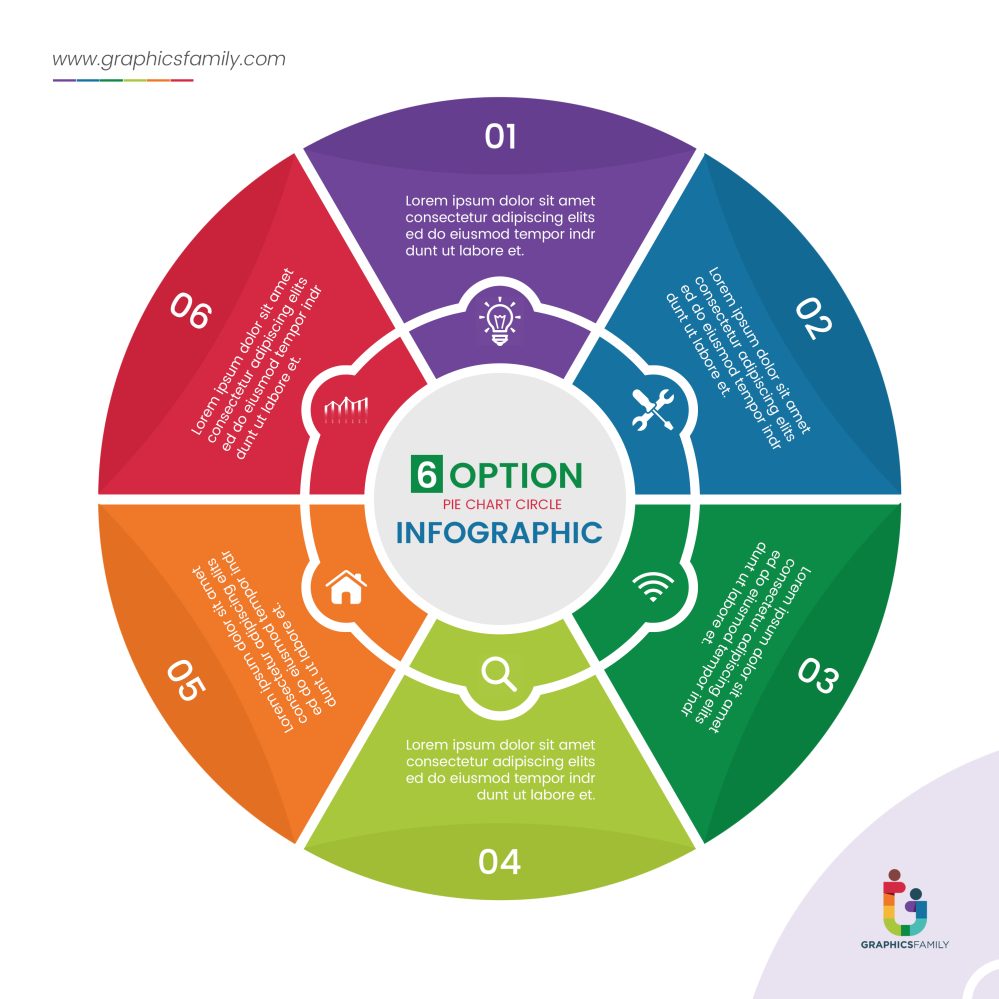
Flat style pie chart circle infographic template vector image
An infographic template: what is it?
A pre-designed layout known as an infographic template makes it simple to produce visually appealing graphics that effectively communicate information. These templates make it easier for those without substantial design experience to create infographics of professional quality by emphasizing structure and design features.
An Infographic Design: What Is It?
An effective method of data visualization, infographics (a combination of the words “information” and “graphics”) highlight important facts and concepts through the use of text and visual components. Infographics make information easier to understand and more powerful by presenting complex data in a visually appealing way.
The Value of Information Graphics
Infographics are essential for presenting data in a number of ways.
Enhanced Retention: The audience is more likely to remember important points when visual aids are used to enhance knowledge retention.
Enhanced Engagement: By adding captivating images to the information, audience involvement is encouraged and the content becomes more desirable and captivating.
📊 Elevate Your Data with Stunning Pie Charts! 🎨
Advantages of Infographics for Products
Visual Attraction: Infographics are naturally captivating, grabbing the viewer’s attention and highlighting the material.
Optimal Readability: They facilitate rapid information comprehension since they are simple to read and comprehend.
Brand Credibility: By presenting information in a polished manner, high-quality infographics can increase the credibility of your brand.
Branding Strategy: By employing your brand’s colors, typefaces, and style consistently, infographics can support your branding initiatives.
Visitors to the website: Vibrant infographics can increase website traffic by piqueing viewers’ interest and promoting sharing.
Enhanced SEO: By making your content more shareable, infographics can raise your website’s search engine rankings.
Simple Tracking: Metrics like shares, likes, and engagement rates make it simple to monitor the success of infographics.
🎯 Visualize Your Insights with Our Infographic Template!
Transmitting a message fast and efficiently is infographics’ main goal. They make complex data easier to understand, highlight links and patterns in the data, and support variable change monitoring. Infographics help the audience understand complex information quickly and easily by accomplishing this.
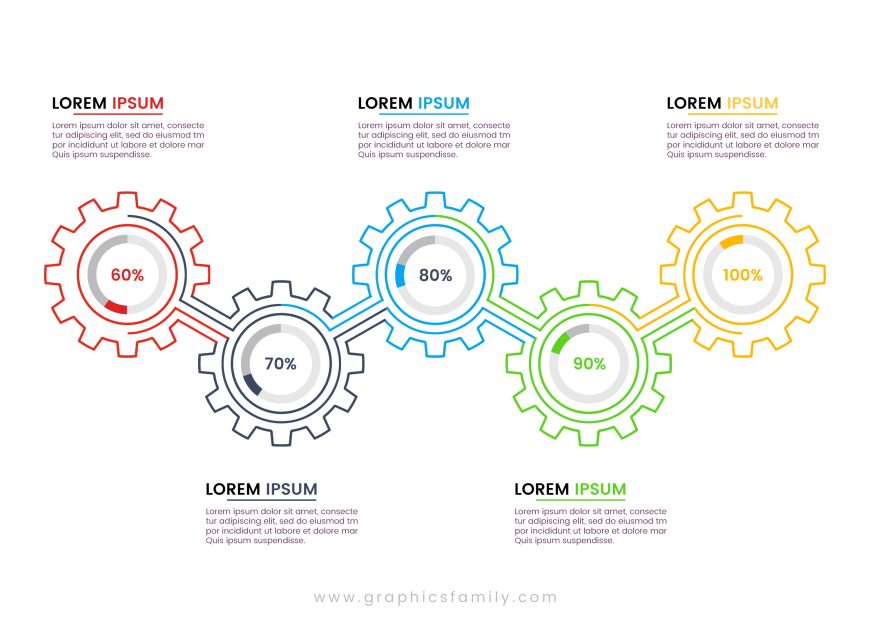
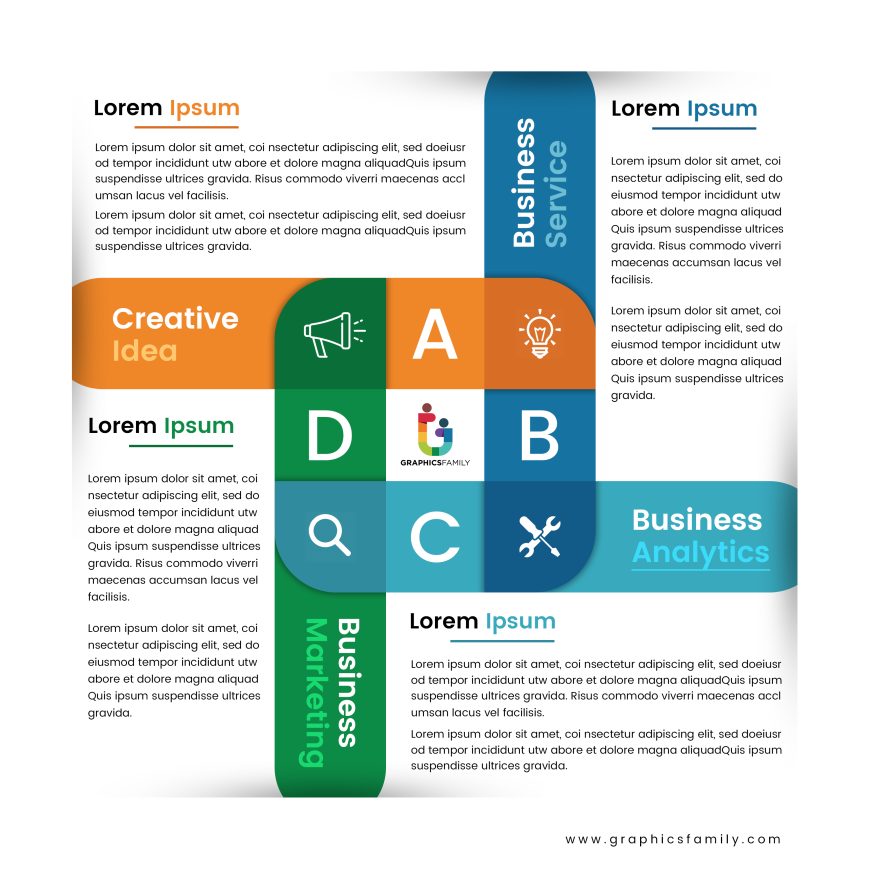
This is an ideal resource for displaying your data graphically. With its modern, flat design and editable pie charts, this template makes it simple to show the relationships and proportions in your data. This template guarantees that your information is presented in a clear, eye-catching, and memorable manner, making it perfect for reports, presentations, and marketing materials.
FEATURES
– 100% Customizable.
– High Quality
– Fully Layered Logo Template.
– .PSD (Source File)
Download
719 downloads